Take-home points
|
 |
Bios Dr. Wang was a retina research fellow at Bascom Palmer Eye Institute in Miami and is starting an ophthalmology residency at New York Eye & Ear Infirmary of Mount Sinai, New York. Dr. Rosenfeld is a professor of ophthalmology at Bascom Palmer Eye Institute. Dr. Trivizki is vice chair of the department of ophthalmology at the Tel-Aviv Medical Center, Israel, a senior research associate at Bascom Palmer Eye Institute, and an assistant professor at Moran Eye Center, University of Utah, Salt Lake City. DISCLOSURES: Dr. Wang has no relevant relationships to disclose. Dr. Rosenfeld disclosed relationships with Gyroscope Therapeutics, Stealth BioTherapeutics, Annexon, Apellis Pharmaceuticals, Bayer Pharmaceuticals, Boehringer- Dr. Trivizki disclosed relationships with PerceiveBio, Galimedix, Truemed and AbbVie. |
Geographic atrophy, or late non-exudative age-related macular degeneration, is characterized by an irreversible, sharply demarcated area of atrophy in the macula that’s associated with the loss of photoreceptors, retinal pigment epithelium and choriocapillaris.1
While GA has been historically diagnosed using fundus biomicroscopy and color fundus imaging, optical coherence tomography has emerged as the preferred tool for directly detecting these anatomical changes in the outer retina, RPE and choriocapillaris.2,3 That’s because OCT offers a highly detailed topographical assessment with depth and layer information of atrophic regions, especially for the earliest atrophic changes preceding the formation of GA.3
In this article, we will explore how OCT has evolved as the preferred imaging tool for identifying the signs of GA earlier in the disease process than conventional fundus biomicroscopy and color imaging have.
OCT B-scan to identify GA precursor lesions
The Classification of Atrophy Meeting (CAM) group has advocated for the use of OCT as the gold-standard for detecting the earliest macular changes that precede the formation of typical GA. The CAM group defined two terms when using OCT horizontal B-scans: 2,3
— incomplete retinal pigment epithelium and outer retinal atrophy (iRORA); and
— complete retinal pigment epithelium and outer retinal atrophy (cRORA).
iRORA is defined as photoreceptor degeneration, RPE attenuation, and increased choroidal signal transmission or choroidal hypertransmission that’s <250 µm on the horizontal B-scan.
iRORA is proposed to be a precursor to cRORA, which includes all the features of iRORA4 but requires the photoreceptor and RPE loss or attenuation and choroidal hypertransmission defect (hyperTD) to be ≥250 µm.
On OCT, cRORA is considered to be an early anatomical measure of GA that would be identified on color fundus imaging.5 iRORA, as a precursor to cRORA, could be useful for monitoring disease onset and progression.4
However, the definitions of iRORA and cRORA on OCT B-scans have some limitations. The 250-µm horizontal cut-off in cRORA wasn’t based on a natural history or histopathological study, but rather because it was a measurement on OCT B-scans that could be reliably and accurately reproduced. The consensus also didn’t determine whether the early macular changes were transient or persistent.
iRORA and cRORA definitions also require highly averaged B-scans. Density of B-scans remains unspecified, which could lead to areas of outer retinal and RPE atrophy being missed if the B-scans are spaced too widely apart.
The orientation of B-scans relative to the location of atrophy and the relative size of the atrophic region may also limit the reliable identification of iRORA.6 Recent studies also indicate that intergrader reliability is lower for iRORA in comparison to cRORA on B-scans.4
En face OCT to identify GA precursor lesions
En face OCT images derived from dense OCT raster scans can also be used for detecting potential precursor lesions of GA.7-13 As an alternative to highly averaged B-scans, en face scans provide comprehensive volumetric views of the retina. Outer retinal degeneration with photoreceptor loss and RPE attenuation is detected through increased choroidal light transmission, which presents as abrupt changes in OCT reflectivity. 7,8,11,14
Using these en face scans, investigators have identified precursor lesions defined as persistent hyperTDs, which are bright lesions with a greatest linear dimension of ≥250 um.9,15 HyperTDs have been shown to serve as an OCT biomarker for predicting the formation of GA.16
 |
|
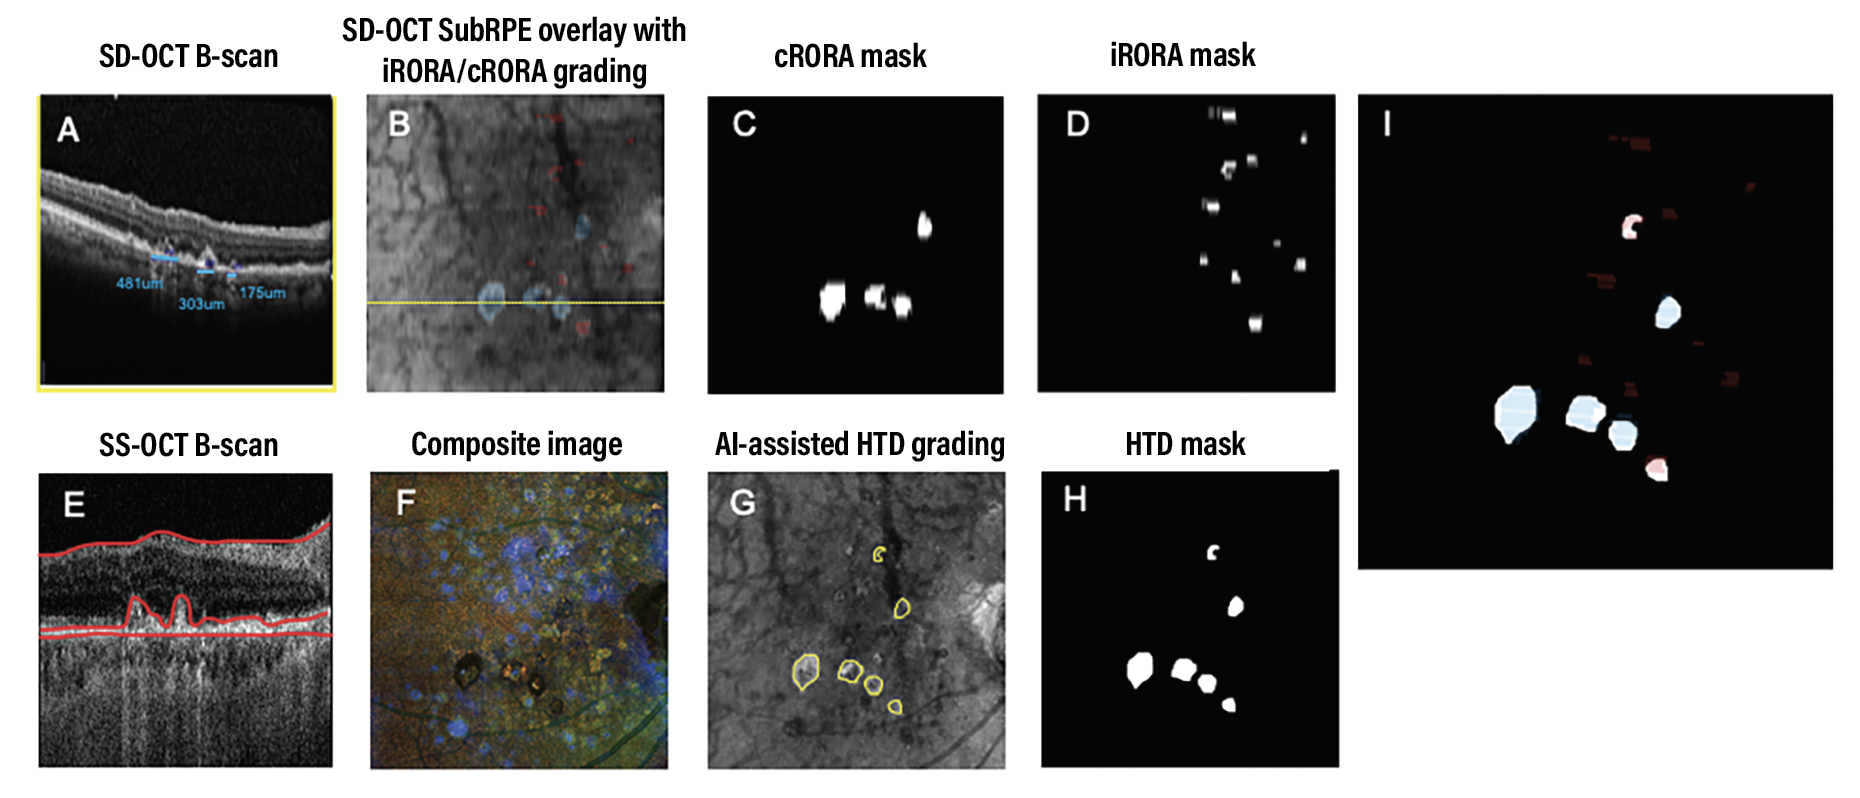
Figure 1. Identification of atrophy in a representative eye using spectral-domain optical coherence tomography and swept-source OCT. Blue represents incomplete retinal pigment epithelium and outer retinal atrophy (iRORA) and red represents complete retinal pigment epithelium and outer retinal atrophy (cRORA) in panels A, B, E and I. |
Reconciling B-scan, en face imaging
With the introduction of iRORA/cRORA on B-scans and persistent hyperTDs on en face imaging as features of early atrophy, these OCT definitions of early atrophy need to be reconciled. Federico Corvi, MD, and colleagues reported significant agreement between persistent hyperTDs on en face imaging and cRORA on B-scans.17
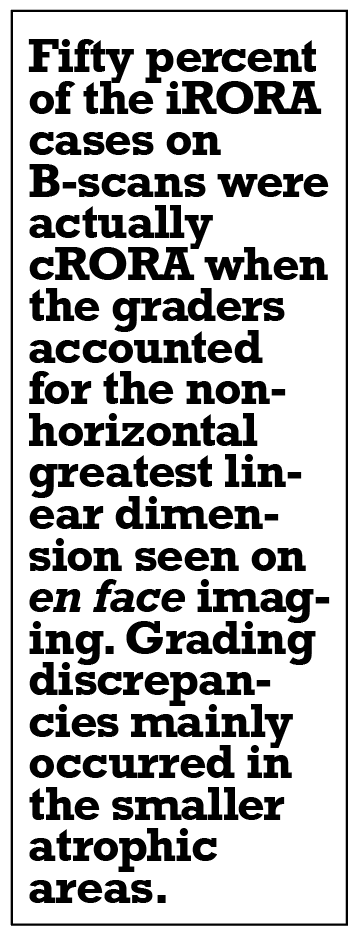
Interestingly, 50 percent of the iRORA cases on B-scans were actually cRORA when the graders accounted for the nonhorizontal greatest linear dimension seen on en face imaging.17 Grading discrepancies mainly occurred in the smaller atrophic areas.
This finding underscores the importance of correctly identifying iRORA by inspecting neighboring B-scans or by using en face imaging to be sure that iRORA isn’t really cRORA or a persistent hyperTD when viewed in a non-horizontal dimension.
 |
Exploring the relationship between cRORA/iRORA and persistent hyperTDs
To explore the relationship and agreement between cRORA/iRORA and
hyperTDs, our research has focused on comparing the grading of cRORA/iRORA on spectral-domain OCT B-scans using a dense raster scan pattern against the grading of persistent choroidal hyperTDs on en face swept-source OCT angiography imaging. Fifteen patients with nonexudative AMD were enrolled at the Tel Aviv Medical Center and completed same-day SD-OCT and SS-OCT imaging. The SD-OCT B-scans were extracted from the averaged 97 B-scans from a 20-degree scan pattern on the Heidelberg OCT instrument.
The B-scans were extracted using the review software and enhanced through contrast-limited adaptive histogram equalization. Masked graders at the Moran Eye Center identified the cRORA and iRORA lesions (Figure 1, above). For this study, cRORA lesions needed to be ≥250 µm when measured on horizontal B-scans or connected to another lesion that was ≥250 µm or linked to four or more lesions resulting in a greatest linear dimension >250 µm along the nonhorizontal slow scan direction.
Persistent choroidal hyperTDs were visualized by en face SS-OCT imaging on a sub-RPE slab with segmentation boundaries between 64 to 400 µm beneath Bruch’s membrane and confirmed on corresponding B-scans. Grading was completed through a collaboration between the University of Washington and Bascom Palmer Eye Institute with a previously developed machine learning algorithm, excluding lesions on en face imaging with a greatest linear dimension <250 µm (Figure 1, above).18,19 Two independent graders then reviewed and manually graded the en face hyperTDs and the corresponding B-scans.
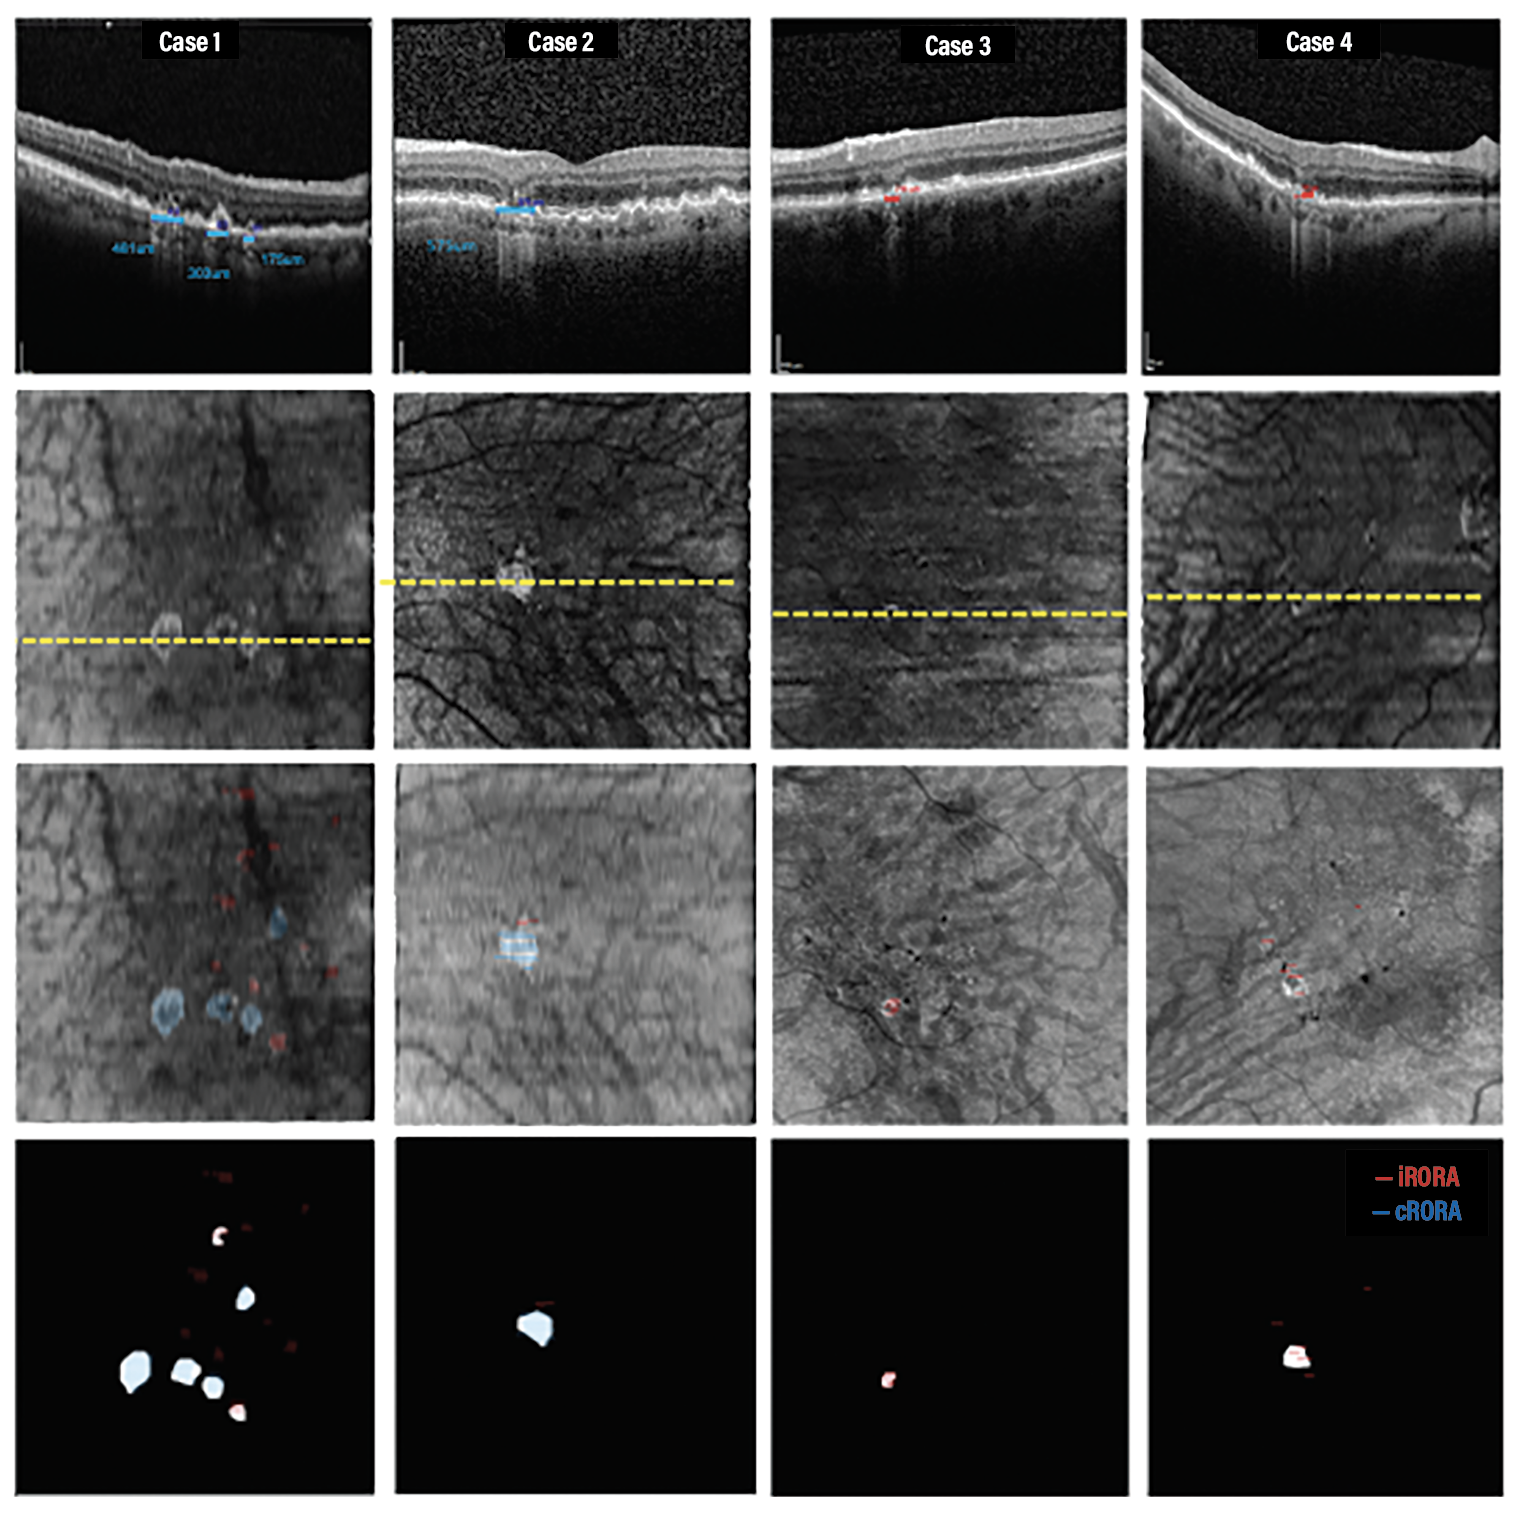 |
| Figure 2. Four representative cases used to grade incomplete retinal pigment epithelium and outer retinal atrophy (iRORA), complete retinal pigment epithelium and outer retinal atrophy (cRORA) and persistent choroidal hypertransmission defects (hyperTDs). iRORA is red and cRORA is blue. The yellow line represents the location of the B-scan in the top row. |
Minimizing mismatches between systems
An SD-OCT iRORA/cRORA mask was manually registered to the SS-OCT images to minimize the mismatch of the lesions between systems and record the overlap between iRORA/cRORA and hyperTD lesions. All graders generated consensus iRORA/cRORA and hyperTD masks. Preliminary data presented at Angiogenesis 2023 indicated that the overlap between B-scan and en face gradings were significantly higher between cRORA and hyperTDs than iRORA and hyperTD.20
Out of the 558 cRORA lesions identified on SD-OCT, 556 were identified as persistent hyperTDs. A strong correlation (R = 0.97) was found between the average area of cRORA and hyperTD with no statistically significant difference in area between groups.
 |
However, out of the 142 iRORA lesions, 39 were also classified as hyperTDs. These “iRORA” labeled lesions were <250 um when measured on the horizontal B-scans, but were also found to be part of larger lesions >250 µm in nonhorizontal dimensions when the entire lesion was taken into account with en face imaging (Figure 2).
These iRORA lesions would have been correctly labeled as cRORA when neighboring B-scans were taken into account. Thus, en face imaging provides an efficient method for assessing persistent hyperTDs that represent early signs of GA formation through inspection of a single en face sub-RPE image rather than a large number of individual B-scans.
En face imaging also allows for atrophic lesions to be topographically correlated with other retinal anatomic features, such as drusen and hyperreflective foci.21 While the detection of iRORA lesions hasn’t yet been incorporated into clinical trial designs, the U.S. Food and Drug Administration has approved the detection of hyperTD formation on en face imaging as a clinical trial endpoint.12 This technique will be valuable in clinical practice, retinal research and clinical trials for determining disease progression and treatment management.
Bottom Line
GA is characterized by irreversible atrophy in the macula with a loss of the outer retina RPE and choriocapillaris. While OCT has been considered to be an optimal tool for directly detecting precise anatomical changes that precede GA, the best OCT imaging strategy to detect these lesions is evolving. iRORA and cRORA have been defined using averaged, horizontal B-scans, and persistent hyperTDs were defined using en face images.
Our research highlights the importance of evaluating persistent hyperTDs when classifying precursor lesions, such as iRORA and cRORA before the detection of GA. Detection of iRORA will require dense OCT raster scans with examination of adjacent B-scans to rule out nonhorizontal connecting lesions.
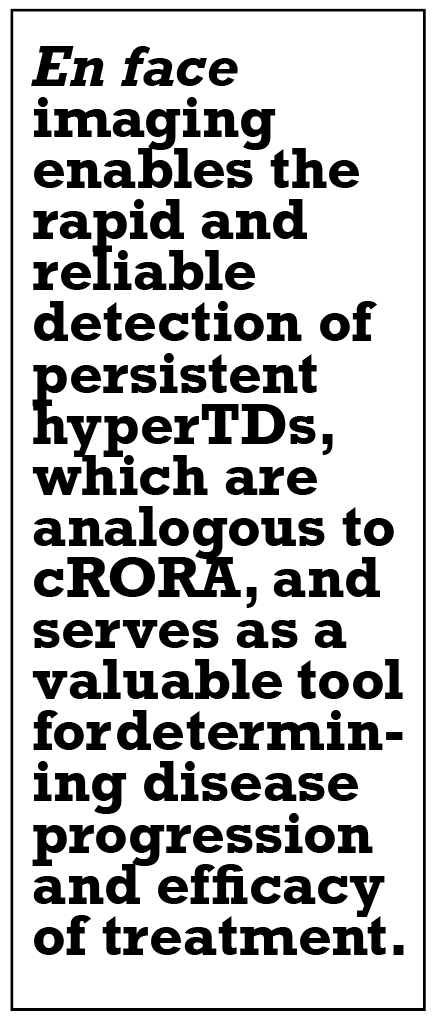
En face imaging enables the rapid and reliable detection of persistent hyperTDs, which are analogous to cRORA, and serves as a valuable tool for determining disease progression and efficacy of treatment in both clinical practice and clinical trials. RS
REFERENCES
1. Holz FG, Bindewald-Wittich A, Fleckenstein M, Dreyhaupt J, Scholl HPN, Schmitz-Valckenberg S. Progression of geographic atrophy and impact of fundus autofluorescence patterns in age-related macular degeneration. Am J Ophthalmol. 2007;143:463-472.e2.
2. Guymer RH, Rosenfeld PJ, Curcio CA, et al. Incomplete retinal pigment epithelial and outer retinal atrophy in age-related macular degeneration: Classification of Atrophy Meeting Report 4. Ophthalmology. 2020;127:394-409.
3. Sadda SR, Guymer R, Holz FG, et al. Consensus definition for atrophy associated with age-related macular degeneration on OCT: Classification of Atrophy Report 3. Ophthalmology. 2018;125:537-548.
4. Wu Z, Pfau M, Blodi BA, et al. OCT Signs of early atrophy in age-related macular degeneration: interreader agreement: Classification of Atrophy Meetings Report 6. Ophthalmol Retina. 2022;6:4-14.
5. Liu J, Laiginhas R, Corvi F, et al. Diagnosing persistent hypertransmission defects on en face OCT imaging of age-related macular degeneration. Ophthalmol Retina. 2022;6:387-397.
6. Corvi F, Corradetti G, Nittala MG, et al. Comparison of Spectralis and Cirrus optical coherence tomography for the detection of incomplete and complete retinal pigment epithelium and outer retinal atrophy. Retina. 2021;41:1851-1857.
7. Yehoshua Z, de Amorim Garcia Filho CA, Nunes RP, et al. Comparison of geographic atrophy growth rates using different imaging modalities in the COMPLETE study. Ophthalm Surg Lasers Imaging Retina. 2015;46:413-22.
8. Nunes RP, Gregori G, Yehoshua Z, et al. Predicting the progression of geographic atrophy in age-related macular degeneration with SD-OCT en face imaging of the outer retina. Ophthalm Surg Lasers Imaging Retina. 2013;44:344-359.
9. Shi Y, Yang J, Feuer W, Gregori G, Rosenfeld PJ. Persistent hypertransmission defects on en face oct imaging as a stand-alone precursor for the future formation of geographic atrophy. Ophthalmol Retina. 2021;5:1214-1225.
10. Thulliez M, Motulsky EH, Feuer W, Gregori G, Rosenfeld PJ. En face imaging of geographic atrophy using different swept-source OCT scan patterns. Ophthalmol Retina. 2019;3:122-132.
11. Thulliez M, Zhang Q, Shi Y, et al. Correlations between choriocapillaris flow deficits around geographic atrophy and enlargement rates based on swept-source OCT imaging. Ophthalmol Retina. 2019;3:478-488.
12. Liu J, Shen M, Laiginhas R, et al. Onset and progression of persistent choroidal hypertransmission defects in intermediate age-related macular degeneration: A novel clinical trial endpoint. Am J Ophthalmol. 2023;254:11-22.
13. Shi Y, Zhang Q, Zhou H, et al. Correlations between choriocapillaris and choroidal measurements and the growth of geographic atrophy using swept source OCT imaging. Am J Ophthalmol. 2021;224:321-331.
14. Cheng Y, Chu Z, Wang RK. Robust three-dimensional registration on optical coherence tomography angiography for speckle reduction and visualization. Quant Imaging Med Surg. 2021;11:879-894.
15. Laiginhas R, Shi Y, Shen M, et al. Persistent hypertransmission defects detected on en face swept source optical computed tomography images predict the formation of geographic atrophy in age-related macular degeneration. Am J Ophthalmol. 2022;237:58-70.
16. Liu J, Laiginhas R, Shen M, et al. Multimodal imaging and en face OCT detection of calcified drusen in eyes with age-related macular degeneration. Ophthalmol Sci. 2022;2:100162.
17. Corvi F, Corradetti G, Laiginhas R, et al. Comparison between B-scan and en face images for incomplete and complete retinal pigment epithelium and outer retinal atrophy. Ophthalmol Retina. 2023;7:999-1009.
18. Chu Z, Wang L, Zhou X, et al. Automatic geographic atrophy segmentation using optical attenuation in OCT scans with deep learning. Biomed Opt Express. 2022;13:1328-1343.
19. Rosenfeld PJ, Cheng Y, Shen M, Gregori G, Wang RK. Unleashing the power of optical attenuation coefficients to facilitate segmentation strategies in OCT imaging of age-related macular degeneration: Perspective. Biomed Opt Express. 2023;14:4947-4963.
20. Trivizki O. When is iRORA really cRORA? Paper presented at Angiogenesis, Exudation, and Degeneration 2023 Virtual Edition, presented by Bascom Palmer Eye Institute, University of Miami Miller School of Medicine. February 10, 2023.
21. Hecht A, Pollreisz A, Sayegh R, et al. Relationship between morphological and vascular alterations in geographic atrophy using a multimodal imaging approach. Acta Ophthalmol. 2020;98:e700-e708.